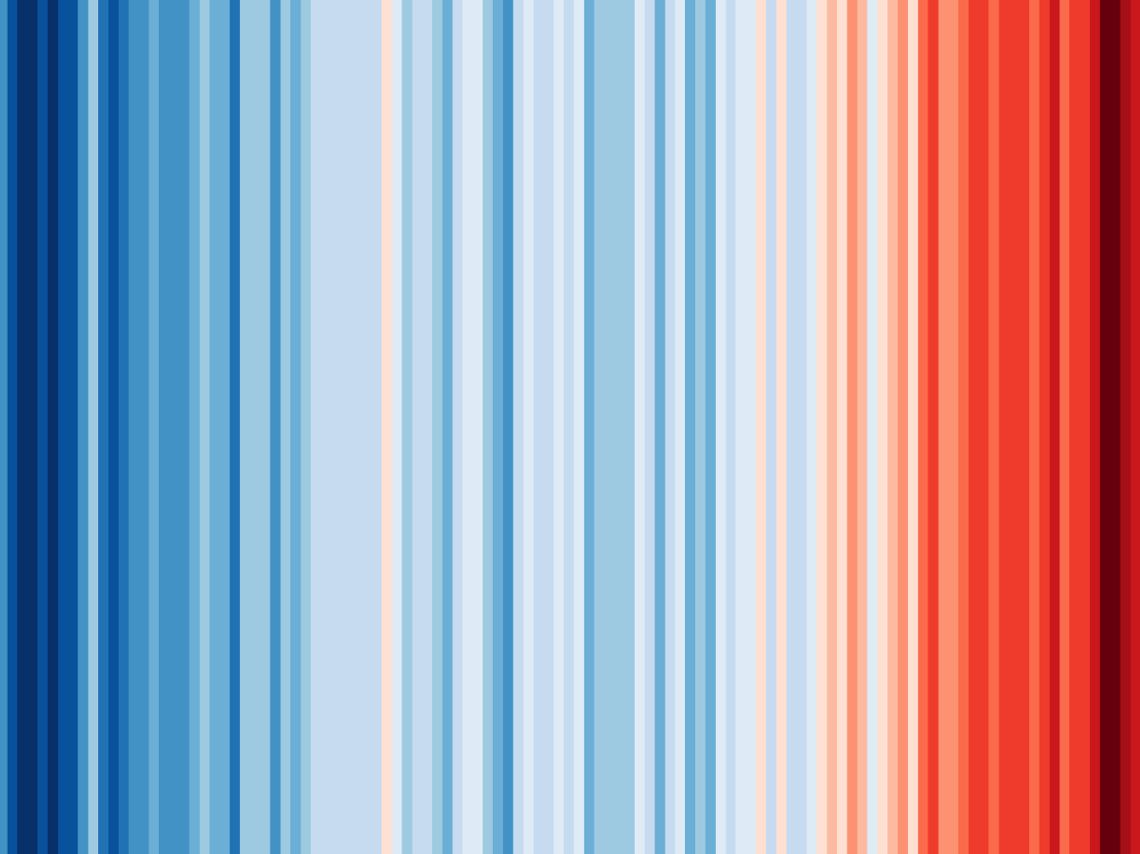
The most striking image of climate science is surely that of the climate stripes developed by Professor Ed Hawkins of the University of Reading. The graphic shows the annual average temperatures for the globe from 1850 – 2018 (cropped below) using data from the UK Met Office. The intensification of the stripe colours towards the red end of the spectrum in recent years is a clear visual representation of the message we hear about the global warming caused by humans.

We proposed to Professor Hawkins the idea of using profits generated from clothes bearing the #ShowYourStripes graphic to be utilised for charitable purposes. He kindly agreed and we’ve been able to set up a membership with a social enterprise focused on carbon offsetting.
You can learn more about how a Mossy Earth membership helps fund reforestation and rewilding projects. If a membership is not right for you at this time, please consider purchasing from the #ShowYourStripes range as profits will be used to fund our Mossy Earth membership allowing you to still contribute to the cause.
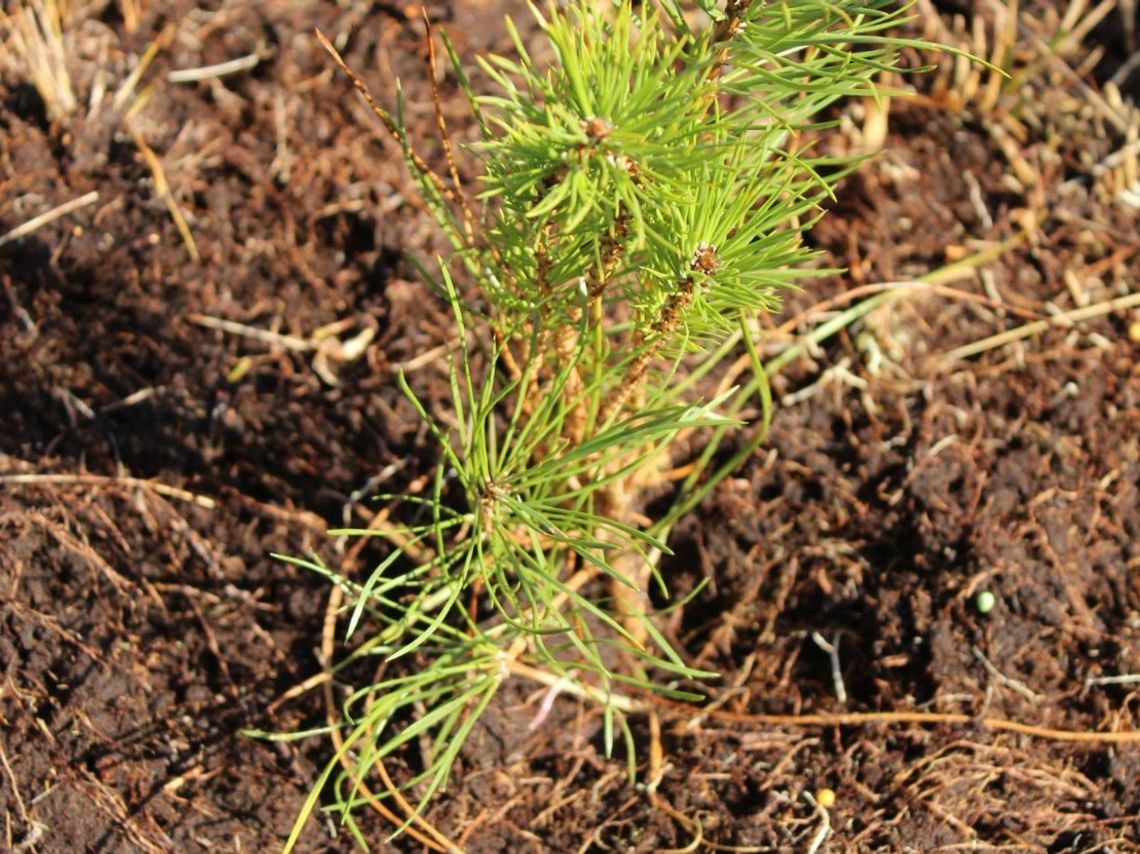
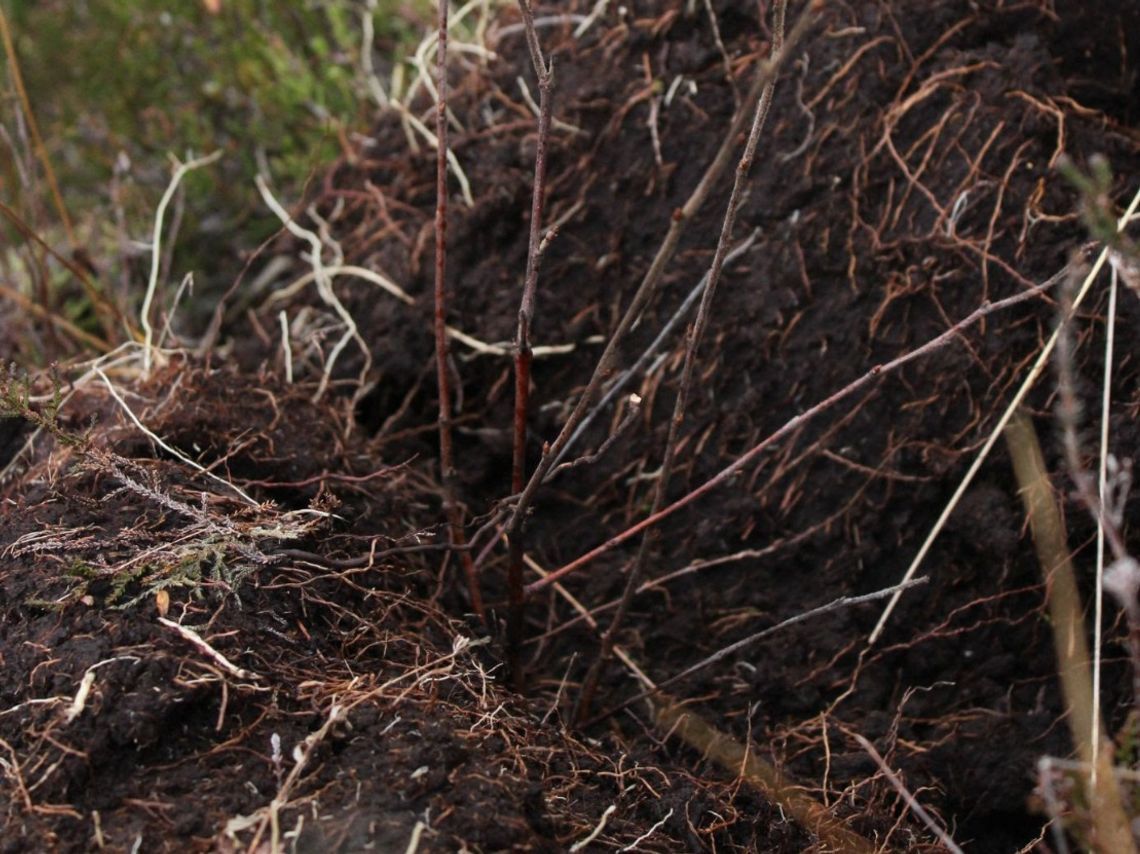
We have now received photos of the first couple of trees planted in Scotland as a result of our membership!


